
Appendix 3
Blackdown Hills National Landscape Management Plan 2025-2030
Appendix 3: Climate
In Appendix 3:
Part A: Climate change adaptation management plans
Part B: Greenhouse gas emissions
Part C: Carbon audit – soil organic carbon
Part A: Climate change adaptation management plans
The Government’s 2023 Climate Adaptation Strategy under the Third National Adaptation Programme (NAP3) requires all National Parks and National Landscapes to have Climate Change Adaptation Management Plans produced, embedded in, or linked with their management plans by 2028, and in all future plans.
Background
The UK government’s third National Adaptation Programme (NAP3) introduces the requirement for all Protected Landscapes to produce Climate Change Adaptation plans by 2028. Whilst the plan can be independent of management plans, it may be easier and beneficial to an authority to complete their Adaptation plan alongside or as part of their management plan. The plans will have regard to relevant guidance and UK government policy.
Protected Landscapes are some of England’s most important areas for delivering on national climate goals, including the government’s target to reach net zero emissions by 2050. Adopting Climate Adaptation Plans will be essential in protecting England’s Protected Landscapes from the impacts of climate change. Alongside the publication of NAP3, climate change adaptation should be considered in each phase of delivering on the ambitions set out in Management Plans. Climate Adaptation should be considered in all aspects of the Authority’s remit, not just the impacts on Nature, but on the People and the Place itself.
Timing
Climate Adaptation plans are to be completed on a 5-year cycle, preferably in line with Protected Landscape management plans. Further to this each Protected Landscape Authority will have a climate adaptation plan in place and published by 2028.
Content
A Protected Landscapes Climate Adaptation Plan should contain action focused policies looking to adapt areas of the designation where climate change is projected to have an impact. Each plan will take the form of the following:
• Identification of areas within the designation that are vulnerable to the impacts of climate change.
• Identification of any new risks since the last Climate Adaptation plan.
• Understanding of the predicted impact and identifying measures for adaptation.
• Evidence on adaptation actions and outcomes and how these interact with socioeconomic drivers and Net-Zero
• Production of an action plan to implement the adaptation measures, ensuring these are SMART.
• Climate Change risk management – governance on how each risk identified is managed.
Those preparing the plans may wish to consider the government’s latest climate change risk assessment (CCRA3). This was informed by the Climate Change Committee’s independent assessment of climate risk.
When identifying actions, ensure there is a responsible owner, even if that is not the Protected Landscape management body – e.g. if infrastructure such as roads may be at risk of damage from extreme weather, work with the responsible authority to identify adaptations.
Those preparing the plan should think broadly on areas at risk across the Protected Landscape designation and be ambitious in the adaptations they can identify.
Publication / Follow up: Climate Adaptation Plans must be submitted to Defra and Natural England once completed and published. Each subsequent climate adaptation plan produced should note in detail the progress that has been made in implementing these adaptations.
To help inform a Climate Adaptation Plan for the Blackdown Hills an initial climate adaptation risk assessment matrix has been prepared. Taking a precautionary approach, this scoping exercise was carried out by a small task and finish group to start to identify the vulnerability of assets and features to the impacts of climate change, based on likelihood and impact. It was based on an approach used by National Parks and others, and can be refined and developed further. The following tables summarise the preliminary draft findings, indicating the effect on a scale ranging between ‘severe risk’ through to ‘significant opportunity’.
Blackdown Hills National Landscape climate adaptation risk assessment matrix
Natural environment
Area of impact: Variety of grasslands
| Headline projection and impact | Risks and opportunities | Risk rating (summary of potential effect on this feature/asset) |
|---|---|---|
| Drier summers, increased likelihood of drought | Unpredictable forage yields and grazing | Severe risk |
| Drier summers, increased likelihood of drought | Deeper rooted plants, including grasses favoured | Moderate opportunity |
| Drier summers, increased likelihood of drought | Flora reducing or ceasing nectar production | Severe risk |
| Hotter summers, increased likelihood of extreme heat | Unpredictable forage yields and grazing | Severe risk |
| Milder wetter winters, increase in rainfall intensity and frequency | Stock kept inside longer, resulting in increased demand for forage | Severe risk |
| Milder wetter winters, increase in rainfall intensity and frequency | Loss of soil | Severe risk |
| Jetstream driven longer winters and milder wetter summers. | Longer growing season | Major opportunity |
| Jetstream driven longer winters and milder wetter summers | Difficulty harvesting | Severe risk |
| Less snowfall, frost and ice | Longer growing season (grass grows when temperature is above 4°c) | Major opportunity |
| Increase in the risk of wildfires | Loss of grazing, natural habitat, loss of wildlife | Major risk |
| Increase in the intensity and frequency of storms | Soil erosion, flooding, grazing unavailable | Major risk |
| Shift in the growing seasons | Longer growing season (grass grows when temperature is above 4°c ) | Major opportunity |
| Milder winters and changes to pest and disease pressures | Loss of pollinators | Severe risk |
| Economic pressures leading to intensification of agriculture | Reduction in grassland leading to diversification | Moderate risk |
Area of impact: Dark skies
| Headline projection and impact | Risks and opportunities | Risk rating (summary of potential effect on this feature/asset) |
|---|---|---|
| Drier summers, increased likelihood of drought | n/a | None/slight |
| Hotter summers, increased likelihood of extreme heat | n/a | None/slight |
| Milder wetter winters, increase in rainfall intensity and frequency | n/a | None/slight |
| Jetstream driven longer winters and milder wetter summers | n/a | None/slight |
| Less snowfall, frost and ice | n/a | None/slight |
| Increase in the risk of wildfires | n/a | None/slight |
| Increase in the intensity and frequency of storms | n/a | None/slight |
| Shift in the growing seasons | n/a | None/slight |
| Milder winters and changes to pest and disease pressures | n/a | None/slight |
| Economic pressure leading to intensification of agriculture | Increase in population density, loss of character. Thoughtless developments. Many impacts of climate change will have indirect effect on dark skies | Severe risk |
Area of impact: Biodiverse small rivers
| Headline projection and impact | Risks and opportunities | Risk rating (summary of potential effect on this feature/asset) |
|---|---|---|
| Drier summers, increased likelihood of drought | Loss of water, reduced river levels or rivers dry up. Potential total loss of aquatic life | Severe risk |
| Hotter summers, increased likelihood of extreme heat | Reduction of water | Severe risk |
| Milder wetter winters, increase in rainfall intensity and frequency | Higher flow, erosion, loss of biodiversity. Increase in invasive species | Major risk |
| Jetstream driven longer winters and milder wetter summers | Flooding, erosion, rivers changing course, silting | Severe risk |
| Less snowfall, frost and ice | n/a | None/slight |
| Increase in the risk of wildfires | n/a | None/slight |
| Rising sea levels | Salinity levels and flood plains may be affected | Minor risk |
| Increase in the intensity and frequency of storms | Flooding, erosion, rivers changing course, silting | Severe risk |
| Shift in the growing seasons | n/a | None/slight |
| Milder winters and changes to pest and disease pressures | Loss of biodiversity, new pests and diseases | Major risk |
| Economic pressure leading to intensification of agriculture | More abstraction, more pollution | Severe risk |
Area of impact: Bat population
| Headline projection and impact | Risks and opportunities | Risk rating (summary of potential effect on this feature/asset) |
|---|---|---|
| Drier summers, increased likelihood of drought | Reduction in number and ranges of invertebrate species and loss of habitat | Major risk |
| Hotter summers, increased likelihood of extreme heat | Reduction in number and ranges of invertebrate species | Major risk |
| Milder wetter winters, increase in rainfall intensity and frequency | Reduction in number and ranges of invertebrate species | Major risk |
| Jetstream driven longer winters and milder wetter summers. | Reduction in feeding opportunities | Severe risk |
| Less snowfall, frost and ice | n/a | None/slight |
| Increase in the risk of wildfires | Risk to roosts | Major risk |
| Increase in the intensity and frequency of storms | Risk to roosts. Risk to feeding opportunities | Major risk |
| Shift in the growing seasons | Reduction in number and ranges of invertebrate species at the right time | Major risk |
| Milder winters and changes to pest and disease pressures | Hibernation impacted | Moderate risk |
| Economic pressure leading to intensification of agriculture | Reduction in habitat | Major risk |
Area of impact: Veteran trees
| Headline projection and impact | Risks and opportunities | Risk rating (summary of potential effect on this feature/asset) |
|---|---|---|
| Drier summers, increased likelihood of drought | Death and dieback of veteran trees | Severe risk |
| Hotter summers, increased likelihood of extreme heat | Change in supported biodiversity | Severe risk |
| Milder wetter winters, increase in rainfall intensity and frequency | More fungal diseases | Major risk |
| Jetstream driven longer winters and milder wetter summers | Change in supported biodiversity | Major risk |
| Less snowfall, frost and ice | Not predictable | None/slight |
| Increase in the risk of wildfires | Loss of ancient trees | Major risk |
| Increase in the intensity and frequency of storms | Soil erosion, trees falling | Severe risk |
| Shift in the growing seasons | n/a | None/slight |
| Milder winters and changes to pest and disease pressures | Risk to key species, e.g. ash dieback, processionary moth etc | Major risk |
| Economic pressure leading to intensification of agriculture | n/a | None/slight |
Area of impact: Ash dominated woodlands
| Headline projection and impact | Risks and opportunities | Risk rating (summary of potential effect on this feature/asset) |
|---|---|---|
| Drier summers, increased likelihood of drought | Death and dieback of trees. Particular risk to young trees | Severe risk |
| Hotter summers, increased likelihood of extreme heat | Change in supported biodiversity | Severe risk |
| Milder wetter winters, increase in rainfall intensity and frequency | More fungal diseases | Major risk |
| Jetstream driven longer winters and milder wetter summers | Change in supported biodiversity | Major risk |
| Less snowfall, frost and ice | Reduction in viability of some species that require chilling period | Severe risk |
| Increase in the risk of wildfires | Loss of woods | Major risk |
| Increase in the intensity and frequency of storms | Soil erosion, trees falling | Major risk |
| Shift in the growing seasons | Not predictable | None/slight |
| Milder winters and changes to pest and disease pressures | Risk to key species, of ash dieback | Major risk |
| Economic pressure leading to intensification of agriculture | n/a | None/slight |
Area of impact: Wildlife diversity
| Headline projection and impact | Risks and opportunities | Risk rating (summary of potential effect on this feature/asset) |
|---|---|---|
| Drier summers, increased likelihood of drought | Reduction / change in biodiversity | Severe risk |
| Hotter summers, increased likelihood of extreme heat | Reduction / change in biodiversity | Severe risk |
| Milder wetter winters, increase in rainfall intensity and frequency | Change in migration patterns. Reduction in pollinators | Severe risk |
| Jetstream driven longer winters and milder wetter summers | Change in migration patterns. Reduction in pollinators | Severe risk |
| Less snowfall, frost and ice | Change in migration patterns | Moderate risk |
| Increase in the risk of wildfires | Loss of habitat | Major risk |
| Increase in the risk of wildfires | Rejuvenation of woodlands | Major opportunity |
| Increase in the intensity and frequency of storms | Loss of habitat | Major risk |
| Shift in the growing seasons | Changes to food chains. Reduction in pollinators | Severe risk |
| Milder winters and changes to pest and disease pressures | Reduction / change in biodiversity | Major risk |
| Economic pressure leading to intensification of agriculture | Reduction / change in biodiversity. Loss of habitat. Reduction in pollinators especially bees | Major risk |
Area of impact: Soils
| Headline projection and impact | Risks and opportunities | Risk rating (summary of potential effect on this feature/asset) |
|---|---|---|
| Hotter summers, increased likelihood of extreme heat | Drier, sandy soils – the top surface will blow away | Severe risk |
| Hotter summers, increased likelihood of extreme heat | Less absorption of rainfall will be likely on clay leading to flooding | Severe risk |
| Milder wetter winters, increase in rainfall intensity and frequency | Waterlogging | Severe risk |
| Milder wetter winters, increase in rainfall intensity and frequency | Inability to get farm equipment into fields | Major risk |
| Milder wetter winters, increase in rainfall intensity and frequency | Potential rotting of seeds before germination | Severe risk |
| Jetstream driven longer winters and milder wetter summers | Inability to get farm equipment into fields | Major risk |
| Jetstream driven longer winters and milder wetter summers | Potential rotting of seeds before germination | Severe risk |
| Less snowfall, frost and ice | Freeze-thaw process compromised | Major risk |
| Increase in the risk of wildfires | n/a | None/slight |
| Increase in the intensity and frequency of storms | Topsoil washing away, depending on crop | Severe risk |
| Shift in the growing seasons | n/a | None/slight |
| Milder winters and changes to pest and disease pressures | Pests and diseases more likely to persist | Major risk |
| Economic pressure leading to intensification of agriculture | Reduction in soil quality, loss of crop, loss of income | Severe risk |
Headlines
Reduced and changed biodiversity – loss of trees, loss of pollinators, loss of water, flooding, loss of soil.
Mitigation actions for natural environment
- Resilient and diverse habitats help to mitigate extremes (as a result of climate change) and well-connected habitat allow species to move to new climate spaces (e.g. different aspects, slopes, feeding and breeding opportunities, shade/ sun) and avoid local extinctions.
- Impacts of browsing regenerating woodlands and trees may need to involve control of browsing animals such as deer.
- Mainstream soil health & regenerative farming & forestry techniques, in order to build resilience of soils, that will in turn help with infiltration of water and storage of carbon.
Farming and forestry
Area of impact: Small scale agriculture
| Headline projection and impact | Risks and opportunities | Risk rating (summary of potential effect on this feature/asset) |
|---|---|---|
| Drier summers, increased likelihood of drought | Change of viable crops and grass favouring deep rooted species | None/slight |
| Drier summers, increased likelihood of drought | Pressure on water resources | Major risk |
| Hotter summers, increased likelihood of extreme heat | Decreased yields and crop failure | Severe risk |
| Milder wetter winters, increase in rainfall intensity and frequency | Increased growing season for grass and other plants | Major opportunity |
| Milder wetter winters, increase in rainfall intensity and frequency | Restricted access to the land for cattle. Change in necessary farming practices | Severe risk |
| Milder wetter winters, increase in rainfall intensity and frequency | Loss of soil | Severe risk |
| Jetstream driven longer winters and milder wetter summers | Restricted access to the land for cattle. Change in necessary farming practices | Severe risk |
| Jetstream driven longer winters and milder wetter summers | Loss of soil | Severe risk |
| Less snowfall, frost and ice | Reduced opportunity to spread slurry | Moderate risk |
| Increase in the risk of wildfires | Risk to all aspects of farming | Severe risk |
| Increase in the intensity and frequency of storms | Flooding and soil erosion | Severe risk |
| Shift in the growing seasons | Change in the viable crop range | None/slight |
| Milder winters and changes to pest and disease pressures | Arrival of new pests from the continent. Increased use of pesticides and medicines at greater cost. Veterinary and plant inspection costs increased | Severe risk |
| economic pressures leading to intensification of agriculture | Diversification and intensification. Loss of farms | Major risk |
| economic pressures leading to intensification of agriculture | Increase of solar panels and energy crops | Major opportunity |
Area of impact: Traditional orchards
| Headline projection and impact | Risks and opportunities | Risk rating (summary of potential effect on this feature/asset) |
|---|---|---|
| Drier summers, increased likelihood of drought | Fruit drop | Severe risk |
| Hotter summers, increased likelihood of extreme heat | Better quality fruit | Significant opportunity |
| Hotter summers, increased likelihood of extreme heat | Reduction of “uniqueness” of English apples | Major risk |
| Milder wetter winters, increase in rainfall intensity and frequency | Loss of chilling period. Increase of root diseases | Major risk |
| Jetstream driven longer winters and milder wetter summers. | Loss of chilling period. Increase of root diseases. Difficulty harvesting | Major risk |
| Less snowfall, frost and ice | Better fruit set | Significant opportunity |
| Increase in the risk of wildfires | Loss of ancient orchards | Major risk |
| Increase in the intensity and frequency of storms | More fungal diseases, increased risk from hail damage | Severe risk |
| Shift in the growing seasons | New varieties, e.g. peaches and nectarines become viable. Interruption of dormant season | Major opportunity |
| Milder winters and changes to pest and disease pressures | Arrival of new pests from the continent. Increased use of pesticides, plant inspection costs increased | Severe risk |
Area of impact: Devon banks
| Headline projection and impact | Risks and opportunities | Risk rating (summary of potential effect on this feature/asset) |
|---|---|---|
| Drier summers, increased likelihood of drought | Change in vegetation profile | Moderate risk |
| Hotter summers, increased likelihood of extreme heat | Change in vegetation profile | Moderate risk |
| Milder wetter winters, increase in rainfall intensity and frequency | Risk of collapse | Major risk |
| Jetstream driven longer winters and milder wetter summers. | Risk of collapse | Major risk |
| Less snowfall, frost and ice | n/a | None/slight |
| Increase in the risk of wildfires | Destruction of banks | Major risk |
| Increase in the intensity and frequency of storms | Risk of collapse | Major risk |
| Shift in the growing seasons | Not predictable | None/slight |
| Milder winters and changes to pest and disease pressures | n/a | None/slight |
| economic pressures leading to intensification of agriculture | Damage due to larger farm equipment | Major risk |
Area of impact: Ancient hedges
| Headline projection and impact | Risks and opportunities | Risk rating (summary of potential effect on this feature/asset) |
|---|---|---|
| Drier summers, increased likelihood of drought | Change in species profile, gapping | Major risk |
| Hotter summers, increased likelihood of extreme heat | Change or reduction in supported biodiversity | Severe risk |
| Milder wetter winters, increase in rainfall intensity and frequency | Change in growing season. More fungal diseases | Moderate risk |
| Jetstream driven longer winters and milder wetter summers. | Change in growing season. More fungal diseases | Severe risk |
| Less snowfall, frost and ice | Not predictable | None/slight |
| Increase in the risk of wildfires | Loss of ancient hedges | Severe risk |
| Increase in the intensity and frequency of storms | Soil erosion, trees falling | Major risk |
| Shift in the growing seasons | n/a | None/slight |
| Milder winters and changes to pest and disease pressures | Risk to key species, e.g. ash dieback, processionary moth etc | Severe risk |
| economic pressures leading to intensification of agriculture | Removal of some hedges | Major risk |
Headlines
Necessary changes to farming practices. Reduced and changed biodiversity – loss of trees, loss of pollinators, loss of water, flooding, loss of soil, new pests and diseases, reduction in crop yield.
Mitigation actions for farming and forestry
- Halo thinning and management of browsing around veteran trees will help make them more resilient.
The built environment, community and economy
Area of impact: Listed buildings
| Headline projection and impact | Risks and opportunities | Risk rating (summary of potential effect on this feature/asset) |
|---|---|---|
| Drier summers, increased likelihood of drought | subsidence | Moderate risk |
| Hotter summers, increased likelihood of extreme heat | Stability of cob construction | Severe risk |
| Milder wetter winters, increase in rainfall intensity and frequency | Reduction in heating required | Major opportunity |
| Milder wetter winters, increase in rainfall intensity and frequency | Flooding | Severe risk |
| Jetstream driven longer winters and milder wetter summers | Flooding | Severe risk |
| Jetstream driven longer winters and milder wetter summers | Increase in heating required | Major risk |
| Less snowfall, frost and ice | Reduction in heating required | Moderate opportunity |
| Increase in the risk of wildfires | Risk to thatch | Major risk |
| Rising sea levels | Increased risk of flooding | Major risk |
| Increase in the intensity and frequency of storms | Flooding, risk of lightning to thatch | None/slight |
| Shift in the growing seasons | n/a | Major risk |
| Milder winters and changes to pest and disease pressures | Increased risk from mould. Damaging species e.g. termites | None/slight |
| economic pressure leading to intensification of agriculture | n/a | Major risk |
Area of impact: Disused farm buildings
| Headline projection and impact | Risks and opportunities | Risk rating (summary of potential effect on this feature/asset) |
|---|---|---|
| Drier summers, increased likelihood of drought | Subsidence | Moderate risk |
| Hotter summers, increased likelihood of extreme heat | Stability of cob construction | Severe risk |
| Milder wetter winters, increase in rainfall intensity and frequency | Flooding | None/slight |
| Jetstream driven longer winters and milder wetter summers. | Flooding | Severe risk |
| Less snowfall, frost and ice | n/a | Major risk |
| Increase in the risk of wildfires | Risk to thatch and wooden construction | None/slight |
| Increase in the intensity and frequency of storms | Flooding, risk of lightning to thatch | None/slight |
| Shift in the growing seasons | n/a | Major risk |
| Milder winters and changes to pest and disease pressures | Increased risk from mould and damaging species to timber structures | Major risk |
| Economic pressure leading to intensification of agriculture | Replacement of traditional farm buildings with modern replacements. Conversion of disused building to dwellings. (class Q) | Moderate risk |
Area of impact: Small villages and hamlets
| Headline projection and impact | Risks and opportunities | Risk rating (summary of potential effect on this feature/asset) |
|---|---|---|
| Drier summers, increased likelihood of drought | Subsidence | Severe risk |
| Drier summers, increased likelihood of drought | Reduced water table; pressure on aquifers | Moderate risk |
| Hotter summers, increased likelihood of extreme heat | Hosepipe bans, reduced garden diversity | Major risk |
| Hotter summers, increased likelihood of extreme heat | Increased housebuilding and infrastructure as a result of migration | Severe risk |
| Milder wetter winters, increase in rainfall intensity and frequency | Flooding | Severe risk |
| Jetstream driven longer winters and milder wetter summers. | Flooding | Severe risk |
| Less snowfall, frost and ice | Reduced risk of parishes being cut off by snow and ice. Reduced risk of injury to people | Major risk |
| Increase in the risk of wildfires | Risk of injury and loss of dwellings | None/slight |
| Rising sea levels | n/a | Severe risk |
| Increase in the intensity and frequency of storms | flooding | None/slight |
| Shift in the growing seasons | n/a | Major risk |
| Milder winters and changes to pest and disease pressures | Risk to gardens and garden biodiversity | Moderate risk |
| economic pressure leading to intensification of agriculture | Reduced water table; pressure on aquifers; increased insurance premiums; higher house prices | Severe risk |
Area of impact: Critical infrastructure
| Headline projection and impact | Risks and opportunities | Risk rating (summary of potential effect on this feature/asset) |
|---|---|---|
| Drier summers, increased likelihood of drought | Loss of drinking water | Severe risk |
| Hotter summers, increased likelihood of extreme heat | Insufficient shading / cooling in urban environments | Severe risk |
| Hotter summers, increased likelihood of extreme heat | Increased drain on medical resources | Severe risk |
| Milder wetter winters, increase in rainfall intensity and frequency | Increased drain on medical resources | Severe risk |
| Milder wetter winters, increase in rainfall intensity and frequency | Increased pressure on sewerage | Severe risk |
| Jetstream driven longer winters and milder wetter summers | Increased drain on medical resources | Severe risk |
| Jetstream driven longer winters and milder wetter summers | Increased pressure on sewerage | Severe risk |
| Less snowfall, frost and ice | Less risk of broken bones due to falls | Major opportunity |
| Increase in the risk of wildfires | Loss of critical buildings e.g. hospitals, surgeries | Major risk |
| Increase in the intensity and frequency of storms | Strain on blue light responders | Major risk |
| Increase in the intensity and frequency of storms | Increased insurance premiums | Major risk |
| Shift in the growing seasons | n/a | None/slight |
| Milder winters and changes to pest and disease pressures | Increased drain on medical resources | Severe risk |
| economic pressure leading to intensification of agriculture | n/a | None/slight |
Area of impact: Low population density
| Headline projection and impact | Risks and opportunities | Risk rating (summary of potential effect on this feature/asset) |
|---|---|---|
| Drier summers, increased likelihood of drought | As people move to the countryside population density may increase. Pressure on infrastructure | Moderate risk |
| Hotter summers, increased likelihood of extreme heat | As people move to the countryside population density may increase. Pressure on infrastructure | Moderate risk |
| Milder wetter winters, increase in rainfall intensity and frequency | n/a | None/slight |
| Jetstream driven longer winters and milder wetter summers | n/a | None/slight |
| Less snowfall, frost and ice | n/a | None/slight |
| Increase in the risk of wildfires | n/a | None/slight |
| Rising sea levels | n/a | None/slight |
| Increase in the intensity and frequency of storms | Some villages prone to flooding may become unsustainable | Major risk |
| Shift in the growing seasons | n/a | None/slight |
| Milder winters and changes to pest and disease pressures | n/a | None/slight |
| economic pressure leading to intensification of agriculture | Increase in density, loss of character | Moderate risk |
Headlines
Increased flooding and pressure on infrastructure, especially medical. Pressure on sewerage and loss of drinking water.
Mitigation actions for built environment, community and economy
- Nature based solutions that build resilience for communities and critical infrastructure, as well as provide a range of co-benefits including for biodiversity, carbon and water quality- e.g. by reducing flooding in the built environment, providing ‘natural sponge’ type functions to store and slowly release water in times of drought and ‘natural filter’ to help improve water quality.
- Tree and shrub canopies provide shade and significant cooling benefits for communities and more tree planting to field boundaries as well as single trees in fields gives protection to livestock and wildlife alike.
Part B: Greenhouse gas emissions
UK Protected Landscapes greenhouse gas emissions statistics: 2005-2022
Greenhouse gas emissions data for the Blackdown Hills National Landscape
Data supplied by Department for Energy Security and Net Zero, 2024. Data reported in kilotonnes of carbon dioxide equivalent (kt CO2e)
| Calendar year | Industry Total | Commercial Total | Public Sector Total | Domestic Total | Transport Total | LULUCF Net Emissions | Agriculture Total | Waste Total | Grand Total | Population (‘000s, mid-yr estimate) | Per Capita Emissions (tCO2e) | Emissions per km2 (kt CO2e) |
|---|---|---|---|---|---|---|---|---|---|---|---|---|
| 2005 | 5.2 | 7.3 | 0.9 | 41.0 | 57.3 | -46.3 | 199.8 | 11.2 | 276.4 | 12.7 | 21.7 | 0.7 |
| 2006 | 5.0 | 7.8 | 0.9 | 42.7 | 55.9 | -47.2 | 195.3 | 10.5 | 271.0 | 12.8 | 21.1 | 0.7 |
| 2007 | 5.0 | 7.5 | 0.9 | 40.3 | 54.8 | -47.9 | 194.5 | 9.7 | 264.8 | 12.9 | 20.5 | 0.7 |
| 2008 | 4.6 | 7.4 | 0.9 | 40.5 | 56.0 | -49.1 | 192.2 | 9.3 | 261.8 | 13.0 | 20.1 | 0.7 |
| 2009 | 4.1 | 6.5 | 0.8 | 38.1 | 53.8 | -49.3 | 192.8 | 9.2 | 256.0 | 13.1 | 19.5 | 0.7 |
| 2010 | 4.3 | 6.8 | 0.8 | 41.4 | 53.3 | -49.5 | 194.3 | 7.3 | 258.6 | 13.2 | 19.5 | 0.7 |
| 2011 | 3.9 | 6.1 | 0.7 | 35.7 | 51.7 | -49.9 | 187.8 | 7.0 | 243.0 | 13.4 | 18.2 | 0.7 |
| 2012 | 4.1 | 6.6 | 0.8 | 37.1 | 51.0 | -48.6 | 193.3 | 6.7 | 250.9 | 13.4 | 18.7 | 0.7 |
| 2013 | 3.8 | 6.2 | 0.7 | 35.8 | 51.8 | -50.2 | 186.4 | 5.7 | 240.1 | 13.5 | 17.8 | 0.6 |
| 2014 | 3.6 | 5.3 | 0.6 | 30.5 | 53.3 | -49.8 | 192.0 | 5.0 | 240.5 | 13.6 | 17.7 | 0.7 |
| 2015 | 3.3 | 4.6 | 0.5 | 28.1 | 57.7 | -50.4 | 195.6 | 5.1 | 244.5 | 13.7 | 17.9 | 0.7 |
| 2016 | 3.0 | 3.7 | 0.5 | 25.6 | 61.2 | -48.7 | 190.1 | 5.3 | 240.7 | 13.9 | 17.4 | 0.7 |
| 2017 | 3.0 | 2.5 | 0.4 | 23.7 | 61.1 | -50.1 | 192.0 | 6.1 | 238.8 | 13.9 | 17.1 | 0.6 |
| 2018 | 3.0 | 2.6 | 0.3 | 23.4 | 61.1 | -49.7 | 185.3 | 5.8 | 231.7 | 14.0 | 16.5 | 0.6 |
| 2019 | 3.4 | 2.7 | 0.4 | 22.0 | 61.9 | -49.9 | 185.6 | 6.7 | 232.8 | 14.1 | 16.5 | 0.6 |
| 2020 | 3.3 | 2.5 | 0.3 | 21.5 | 50.3 | -50.6 | 181.9 | 5.7 | 214.9 | 14.1 | 15.2 | 0.6 |
| 2021 | 3.7 | 2.8 | 0.3 | 21.9 | 57.9 | -49.6 | 185.8 | 3.0 | 225.9 | 14.1 | 16.0 | 0.6 |
| 2022 | 3.0 | 2.7 | 0.3 | 19.7 | 58.3 | -49.5 | 166.6 | 3.9 | 204.8 | 14.2 | 14.4 | 0.6 |
Part C: Carbon audit – soil organic carbon
In 2022, the National Association of AONBs (now the National Landscapes Association) commissioned Cranfield University to undertake a Carbon Audit and Metric (land management) assessment. [Zawadzka, J.E., Keay, C., Hannam, J., Burgess, P.J, Corstanje, R. (2022). National Landscapes Carbon Audit & Metric (land management), Bedfordshire: Cranfield University.]
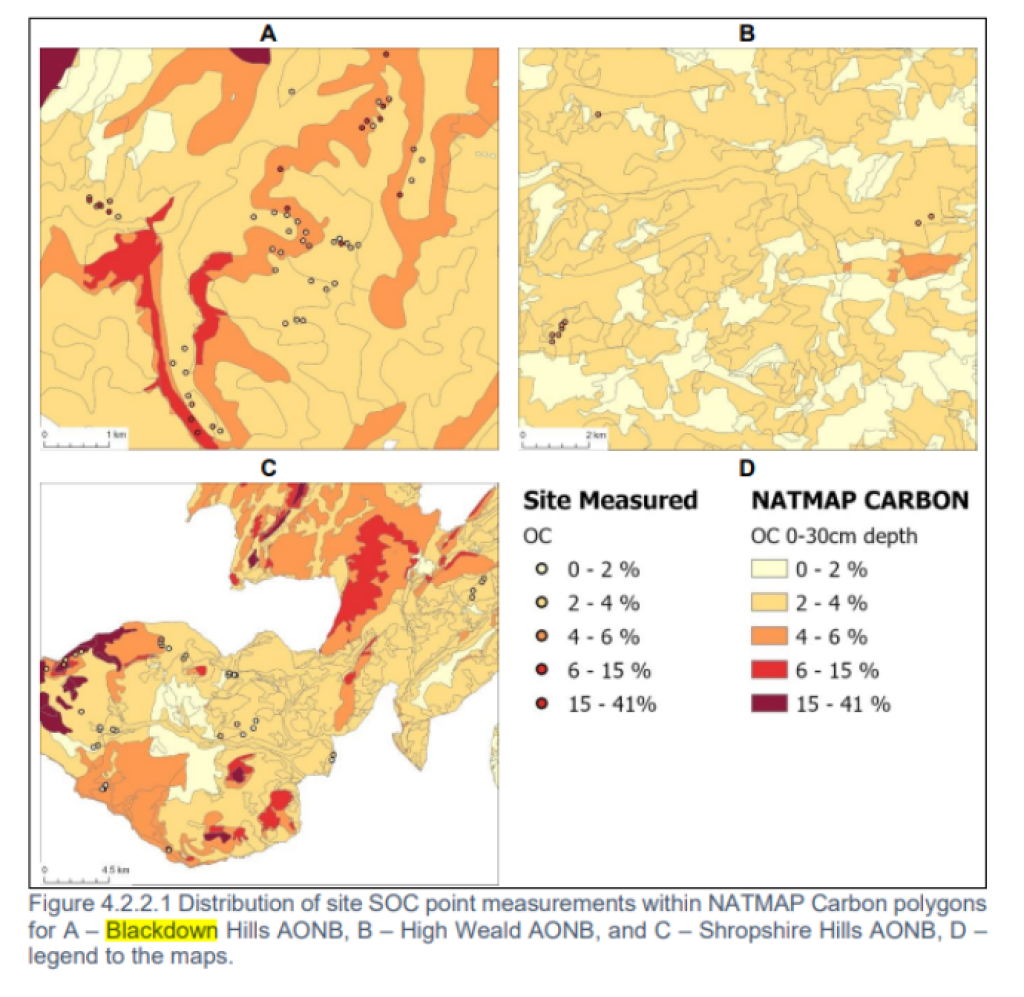
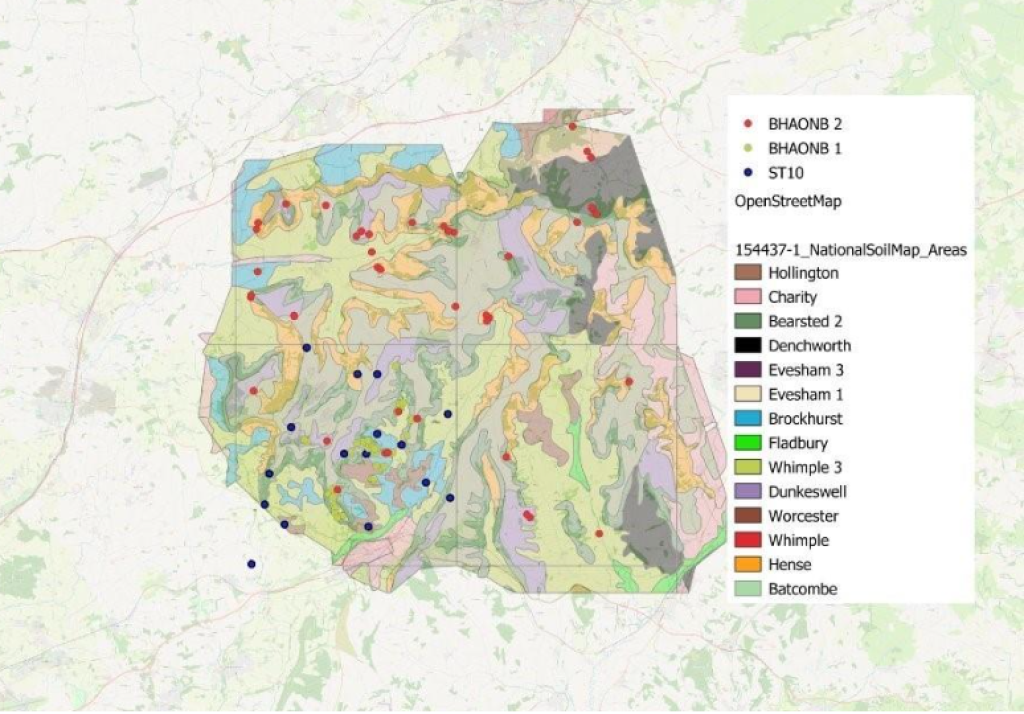
Before the National Landscape-specific datasets could be used for comparison with NATMAP Carbon, it was necessary to ensure that the data referred to the soil organic carbon (SOC) contents for a soil depth of 0-30cm, which is one of the depths data in NATMAP Carbon are reported at. Brief descriptions of the sampled data are available in Table 4.2.1. Samples obtained from the Blackdown Hills National Landscape covered the soil depths of 0 – 15 and 15 – 30 cm and an average value of organic carbon reported at these depths was calculated for comparison to the 0 – 30 cm depth in the NATMAP Carbon dataset. This was only possible for 59 out of 74 samples which had data for both depths. Observations that reported organic carbon for the 0 – 15 cm depth only were discarded.
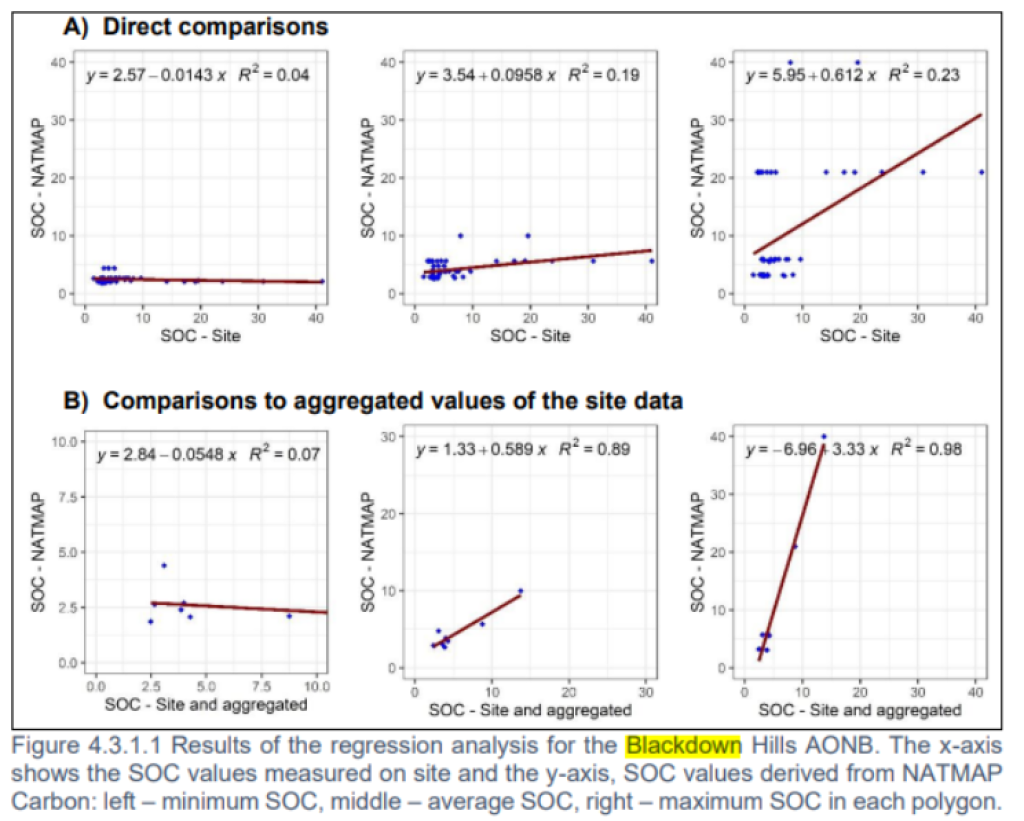
In the Blackdown Hills National Landscape (Figure 4.3.1.1) the direct comparisons were the strongest (R2 = 0.23) for the maximum SOC values in NATMAP, which was likely determined by the fact that samples within that National Landscape were taken from various semi-natural habitats, which likely store more carbon is soils. After aggregation of the site measurements to NATMAP polygons, this relationship increased to 0.98, indicating near-perfect agreement. The indirect comparison resulted in fairly good fit of the site measurements to the average value of SOC assigned to the NATMAP polygons, with R2 of 0.89. In the case of this National Landscape the relationships with the minimum SOC values reported by NATMAP was the weakest, which could be explained by the overall high SOC contents of the sampled soils.
The aim of the comparisons carried out between minimum, mean and maximum SOC values reported by the NATMAP Carbon database at national scales to SOC data sampled on sites within selected National Landscape s was to evaluate whether soil carbon stock assessments based on the NATMAP dataset could reliably represent soil carbon within the National Landscapes. The results of these comparisons indicate that NATMAP does not represent local, i.e., within-field, variations in SOC very well, however, it can reliably represent soil carbon at wider scales such as related neighbourhoods or landscapes. Results obtained here confirmed findings of a previous study indicating that NATMAP Carbon can represent soil carbon well for areas with relatively low SOC stocks at field rather than sub-field scales (Beka et al., 2022). The results of the comparisons presented here should be treated as indicative, given that the site samples were collected for other purposes than the evaluation of the capacity of NATMAP to accurately represent soil carbon at local scales. Some other sensitivities affecting the strength of the relationship include different laboratory methods to extract soil carbon from samples or different sampling dates – NATMAP is based on legacy soil observations collected by the Soil Survey for England in Wales, spanning across 1939 to 1987, with possible changes in soil carbon contents over time due to past changes in land use and management (Kirk and Bellamy, 2010).
Report: Soil organic carbon in the Blackdown Hills National Landscape: towards a framework for guiding land management decision-making
A study undertaken in winter 2022-2023 in the Blackdown Hills National Landscape. This was a follow-on piece of work, building on the Cranfield carbon audit & metric study.
Project objectives:
- To identify which soil types are most valuable for their existing carbon stores
- To identify which soil types have the greatest potential to sequester more carbon via land management change
- To develop this information into the basis for practical guidance for land managers in the Blackdown Hills National Landscape
Soil carbon:
- UK soils store over 10 billion tonnes of carbon, roughly equal to 80 years of annual UK greenhouse gas emissions
- Soil carbon sequestration = CO2 being removed from the atmosphere and stored in the soil in the form of soil organic carbon
- Soil organic carbon drives the mechanisms of infiltration and retention of air, water and nutrients in the soil which provide multiple benefits to farmers and society
Net zero:
- The UK Government has committed to reaching net zero greenhouse gas emissions by 2050.
- Sectors such as industry, agriculture and aviation will be difficult to decarbonise completely by 2050.
- Greenhouse gas removal (GGR), such as through soil carbon sequestration, is therefore essential to compensate for the residual emissions
Agriculture, net zero and soils:
- Estimates suggest that UK agricultural land could sequester 1-2 tonnes of CO2e per hectare per year
- The move towards ‘blended’ finance for agricultural support – mixing Government support with private finance –means land managers will soon be encouraged to store more carbon on their land, and realise a market value for that carbon by selling carbon credits
- A ‘carbon market’ is rapidly evolving, but we lack an understanding of current soil carbon stores and metrics for measuring it, both at a landscape and single farm scale.
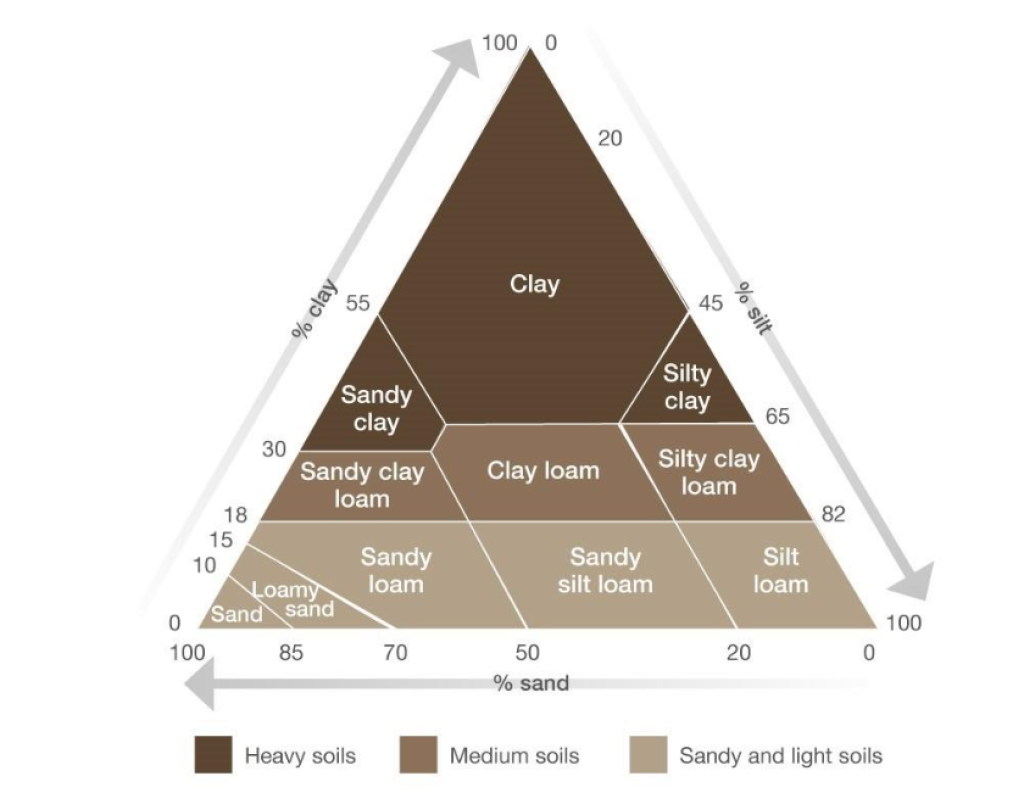
Soil type and carbon storage:
- This project focuses on the carbon in the soil, rather than in the vegetation
- Soils vary across the landscape, and each soil type has a different inherent capacity to store carbon. That capacity remains the same, though land use and vegetation may vary
- If a soil type has a high inherent carbon-storing potential, then carbon sequestration efforts directed towards that soil type will yield the best results
Headlines
Different soil types vary greatly in their carbon stores, and their potential to hold more carbon.
Soil carbon storage can be increased both through productive, in-field practices, and habitat creation or management.
Managing productive soils to store more carbon also improves soil health.
Managing wildlife habitats and creating new habitat also increases soil carbon storage.
Each soil type can be managed to maximise its ability to store carbon, and the opportunities for doing so vary between soil types.
Vegetation with high nature conservation value generally has the highest level of soil organic carbon (SOC), with wet woodland, mire, and wet heath having the highest of all.
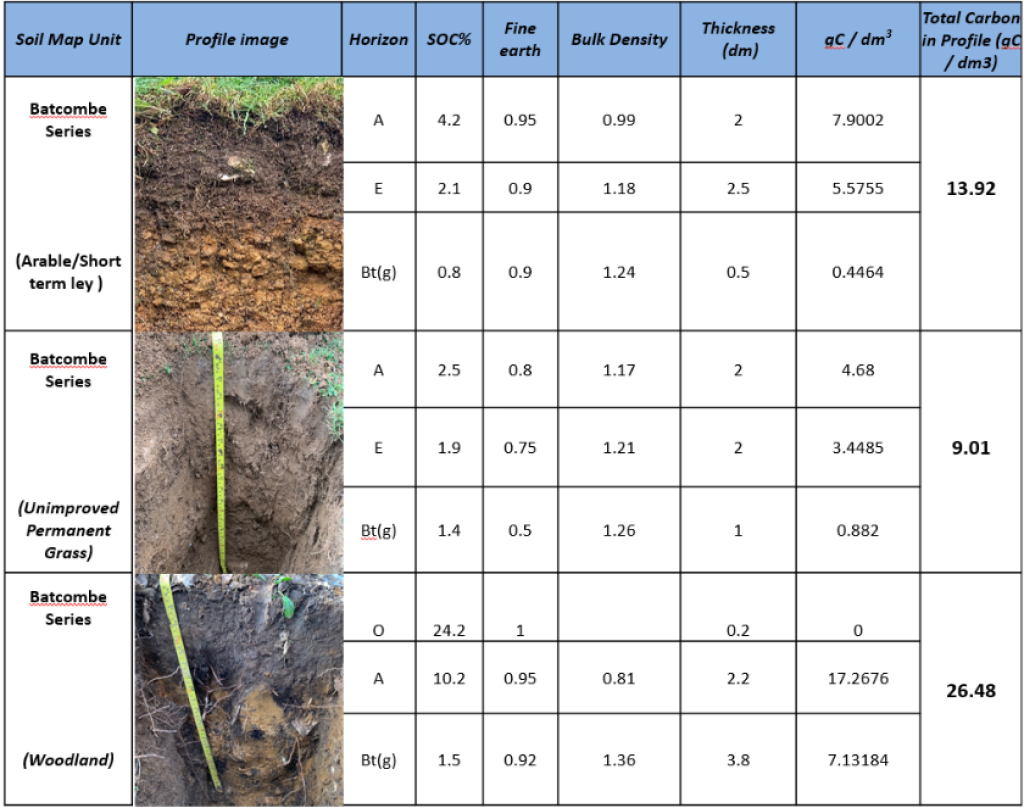
The peaty and organic ‘Blackdown’ and ‘Hense’ soil types store the most carbon per hectare.
Medium brown soils with a large area in the landscape, such as the ‘Whimple’ and ‘Batcombe’ soil types, can play a significant role in carbon sequestration via good soil management practices.
A focus on soil carbon can offer a triple-win, for carbon sequestration, soil health, and biodiversity
- Humic soils (e.g. Hense) – found on the springline
- These naturally wet soils have high carbon levels when carrying semi-natural vegetation. Where they have been drained and agriculturally improved, rewetting them and restoring semi-natural vegetation could yield significant carbon gains
- Brown Earths (e.g. the Batcombe) – found on the plateau
- These have a lower capacity for holding carbon (compared with wetter soils), but their extent means that the raising their soil carbon by just a small amount would have a significant impact on total carbon stocks in the landscape
| Soil map unit | Area (ha) in Blackdown Hills | Tonnes Soil Organic Carbon per ha | Total SOC (tonnes) in Blackdown Hills |
|---|---|---|---|
| Batcombe | 8,690 | 11.60 | 100,838 |
| Bearstead | 4,786 | 11.25 | 53,847 |
| Blackdown | 2,000 | 32.36 | 64,720 |
| Brockhurst | 5,561 | 16.33 | 90,801 |
| Charity | 3,035 | 9.70 | 29,450 |
| Denchworth | 4,729 | 17.16 | 81,130 |
| Dunkeswell | 3,318 | 14.79 | 49,069 |
| Evesham | 2,553 | 18.68 | 47,701 |
| Fladbury | 915 | 32.29 | 29,548 |
| Hallsworth | 302 | 18.03 | 5,455 |
| Hense | 5,607 | 44.87 | 251,608 |
| Hollington | 1,236 | 17.66 | 21,844 |
Footer Navigation
Widget


Widget